What if the real problem is planning to work too long? Photo by George Bakos on Unsplash.
Reading time: 9 minutes
Understanding the Retirement Spending Smile
Quick Answer: What Is the Retirement Spending Smile?
The Retirement Spending Smile describes how most retirees do not spend a constant amount over time. Instead, spending is typically higher early in retirement (Go-Go years), declines in mid-retirement (Slow-Go), and may rise slightly late in life (No-Go) due to health and care needs.
The key insight is that planning for flat, inflation-adjusted spending can cause you to over-save and work longer than necessary, especially if much of your budget is discretionary.
What You’ll Get From This Article
✔ A clear explanation of the Retirement Spending Smile
✔ The Go-Go / Slow-Go / No-Go framework backed by real retirement research
✔ Why fixed spending assumptions and the 4% rule can overstate how much you really need to save
✔ A case study illustrating how modelling the Smile could enable earlier retirement
✔ How the Smile applies to FIRE (Financial Independence, Retire Early)
✔ Practical guidance on front-loading experiences without risking financial security
The 4% Rule: Assumptions You Should Re-examine
In today’s post, we cover how expenses in retirement typically change over time and what it means for your retirement portfolio target. Could we be working longer than we need to in a career we don’t find fulfilling in the expectation of expenses that don’t end up materializing? Having a good understanding of what our expenses will be in retirement is critical to carving out an effective strategy to get there.
Conventional retirement wisdom tends to plan for fixed spending over time once we step away from our jobs. In particular, the 4% rule (of thumb) is used extensively by would-be retirees when trying to figure out how much they can pull from their portfolio each year in retirement. We covered the pros and cons of the 4% rule—and every other major withdrawal strategy—in our complete guide to safe withdrawal rates for early retirees.
The popular 4% rule assumes you’ll maintain the same inflation-adjusted withdrawal every year, irrespective of how expenses change. If you were to retire at, say, age 60 with a nest egg of $1M, the 4% rule suggests you can safely withdraw $40,000 (4% of $1M) in year one, and adjust for inflation in subsequent years. Over a 30-year timeline and a balanced portfolio allocation (e.g., 60 stocks /40 bonds), it is very unlikely you will run out of money following this approach.
The 4% rule of thumb is also commonly used to determine when you can retire. Say you envision a $60,000 annual spend in retirement; then, according to this approach, you will need to have $1.5M ($60,000/0.04) invested in your portfolio to step away from your career. Different calculators—as we’ll show further below—provide you with what the timeline looks like when considering other input variables like your current net worth and existing investments.
However, a major drawback of fixed withdrawal plans is they don’t reflect actual patterns of retiree spending over time. Today, we explore how spending usually evolves in retirement—and whether many of us may be over-saving and over-working—in pursuit of a portfolio that is larger than necessary.
This is where the concept of the “Retirement Spending Smile” comes in: retiree spending tends to fall gradually through mid-retirement, then rise again late in life, mainly due to healthcare costs. Plotted over time, the curve resembles a smile.

Do you really need that much money in old age? What type of spendy activities do you plan in your late 70s and early 80s? You may be over-saving for retirement. Photo by Max Harlynking on Unsplash.
Retirement Spending Phases: Go-Go, Slow-Go & No-Go
Decades of retirement research show that spending does not remain flat after retirement. Instead, it follows a predictable three-phase pattern—often described as the Go-Go, Slow-Go, and No-Go years—each with a distinct spending behavior. This pattern has been documented extensively in retirement research, including the work of Dr. David Blanchett.
The Go-Go years reflect the most active period of retirement. Depending on health constraints and your biological age, this phase usually takes place between ages 60 and 75. However, most people overestimate how long they’ll actually stay healthy enough to enjoy it. American retirees spend only about 58% of their post-retirement years in good health, which means around eight healthy years for someone retiring at 65. We explore this in depth in our article on how long you’ll really live in good health after retirement.
During this phase, retirees recently stepped away from their decades-long grind and are excited to make the most out of their new-found freedom. Crucially, they are still in good enough health to pursue an active lifestyle filled with travel, hobbies, and meaningful daily activities that require funding. It’s easy to see how this phase will have higher annual costs.
But as our mid-70s approach, we start to transition into the Slow-Go years. During the following decade, research shows that we start to spend less than in the earlier years of retirement. We have less desire to travel, we are more home-bound, and our focus tends to shift towards family—perhaps grandchildren—and comfort.
Although the exact timing varies from person to person—depending on their health and energy levels—it’s reasonable to expect that most of us will go through a similar spending pattern in retirement.
Finally, we enter the No-Go years. As the name implies, here we experience a very significant reduction in activity, which keeps our spending down, at least at first. However, after a few years following this downward trend, we should expect to experience a potential bump over the final years of life due to health care-related costs.
This three-phase pattern produces the smile-shaped curve known as the Retirement Spending Smile, reflecting how spending dips in mid-retirement and rises later on (Figure 1). The Figure below serves only to illustrate the concept; the original plotted data you can find in Figure 5 of Blanchett’s original research.

Figure 1. Estimated retirement spending for a $100,000 initial budget at 65 versus a constant inflation-adjusted spending strategy. Retrieved from retirement-researcher.com. This plot uses original annual changes in spending from Blanchett’s original 2014 research.
How Fixed Spending Leads to Overworking & Oversaving
Retirees relying on fixed spending rules tend to over-save and work longer than necessary. What the research underpinning the Retirement Spending Smile suggests is that many retirees may be over-saving, possibly by around 10 to 20%. This illustrates the retirement spending paradox: even as retirees fear running out of money, their actual expenses often decline with age, resulting in higher net worths over time.
Targeting a larger retirement portfolio than needed often means working longer careers we are not passionate about and missing out on key life experiences. As we discussed in our previous article on Bill Perkins’ Die With Zero philosophy, over-working is not just being conservative to cover unexpected retirement expenses, which can be addressed more efficiently with insurance. Overworking sacrifices your health and time, resources you may never enjoy if you don’t draw down your savings wisely.
It can be particularly wasteful because you may be trading healthy years where you still have enough energy to maximize fulfilling and memorable experiences. You are working several years more at the potential expense of missing family trips, time with your friends, and pursuing other interests and key life-long goals. Let’s use a concrete example to run some numbers and see what impact it could have.
Case Study: Retiring Sooner by Modeling the Smile
Using our Financial Independence Calculator, let’s assume a household case study with the following characteristics:
Country: US
Current age: 55
Current investment portfolio: $800,000
Net annual income: $80,000
Current annual expenses: $70,000
Projected expenses in retirement: $70,000
Assumed real return on investments: 7% (core portfolio consists of low-cost, internationally diversified index funds)
Safe withdrawal rate: 4% (as per the 4% rule of thumb)
Under these circumstances, this individual could expect to retire at age 65, as observed in the calculator’s output in Figure 2. Given the household’s current net worth and 12.5% savings rate, it would take around 10 years to reach retirement.

Figure 2: Output of our Financial Independence Calculator (free, email unlock). Under the assumptions and input data outlined above, the baseline timeline to reach retirement is 10 years.
Could this retiree leave work earlier by modeling expenses along the Retirement Spending Smile trajectory? Let’s run the numbers again, but this time assuming a portfolio that is 20% lower than the original target portfolio. Instead of targeting a $1.75M portfolio ($70,000 / 0.04), we now consider an annual spend of $56,000 or targeting a nest egg of $1.4M ($56,000 / 0.04). This assumes our discretionary expenses will reduce substantially during the Slow-Go and No-Go years.
Figure 3 illustrates that under a 20% smaller nest egg, this retiree could retire three years earlier. Three years earlier may not seem like much, but what about if you think about it as 36 months? That is a lot of enjoyment you can juice out of life while you are still relatively young and healthy. How many memorable life events and adventures can you fit into 36 healthy months?

Figure 3: Output of our free, Financial Independence Calculator. By considering the Retirement Spending Smile and a 20% reduced portfolio target, the individual is now able to retire around 3 years sooner than in the baseline scenario (age 62 instead of 65).
Who Benefits Most from the Retirement Smile
The Retirement Spending Smile applies best to households with flexible, discretionary spending, not to bare-bones budgets. The more discretionary spending you have built in your budget, the more confident you can be on following this variable pattern of spending in retirement.
If most of your retirement budget is already fixed (housing, food, healthcare), the Smile still exists, but its impact will be much smaller. And if you’re planning to retire on the bare minimum, as is often the case with very tight LeanFIRE plans, it’s probably safer not to count on it at all.
In contrast, if you are targeting a $4M portfolio by age 65, chances are you will make it to the grave with a lot of unspent money. Under this example, the would-be retiree is likely leaving memorable life experiences with their loved ones on the table while they are still relatively young and healthy. In this scenario, it really does make sense to consider the Retirement Spending Smile concept, and how you likely don’t need to target such a large portfolio in the first place.
Why 5% SWR + Guardrails May Outperform the 4% Rule
Bill Bengen, the creator of the 4% rule, now recommends using a 4.7% safe withdrawal rate. The original 4% rule only considered a fairly basic portfolio of US large cap stocks and intermediate US bonds. Using updated data and a more diversified portfolio, Bill Bengen now believes a 4.7% safe withdrawal rate (SWR) can replace the previous 4% guideline. It’s important to remember that this 4.7% SWR represented the most conservative withdrawal possible; it would have weathered the worst historic periods of poor returns and high inflation.
Let’s update our case study above using a 5% safe withdrawal rate instead of the 4% approach. Plugging in this new information in our Financial Independence Calculator, we are able to retire 3 years earlier than the baseline scenario ($1.75M portfolio and 4% rule). If we also consider the Retirement Spending Smile effect, the case-study individual could retire 6 years earlier at age 59.
👉 If you’d like to see what modeling your own spending phases would do to your retirement date, that’s one of the scenarios we work through in my 1:1 FI Strategy Sessions.
If you feel nervous about applying a higher safe withdrawal rate than 4%, consider using the 5% safe withdrawal rate with guardrails, which I explain in a dedicated article covering smarter alternatives to the 4% rule. Also consider Bill Perkins’ advice that we should be more scared of misliving and missing out on memorable experiences while still relatively young and healthy than of running out of money when we are old and frail.
For those whose main remaining worry is the longevity tail—running out of money in their 80s and 90s—a small deferred income annuity (DIA) can address that specific risk more efficiently than working extra years to build a larger buffer. We examine this in our annuities for early retirees guide.

Instead of over-saving, why not enjoy an earlier retirement while you’re still healthy? Photo by M o e on Unsplash.
Applying the Retirement Smile to the FIRE Strategy
Until now, we’ve assumed a conventional retirement age of 60-65, but how does the Retirement Spending Smile apply to FIRE folks? If you are pursuing FIRE (Financial Independence, Retire Early), you likely have a much longer than 30-year retirement horizon to consider. Under these conditions, is the Retirement Spending Smile still relevant to you?
In general, for very early retirees, the smile effect still applies, but is shifted to later in life. FIRE folks in their 30s, 40s, and 50s in a way are drastically extending their Go-Go years, where they are still healthy and energetic. But at a similar point in time, the Slow-Go and No-Go years will eventually creep up on them too.
From a portfolio perspective, though, the Retirement Spending Smile is less relevant to early retirees. Reducing your portfolio by 20% is a very bold move if you are considering a 40 or 50-year retirement timeframe, especially given the higher risk early retirees face with Sequence of Return Risk (SORR). Therefore, I personally would not do any adjustments early on when deciding on the moment to retire or the retirement portfolio to target.
However, as you approach age 60, it may be a good moment to reassess your situation. What does the nest egg look like now? Here it makes a lot of sense to reconsider what your current annual consumption is, because it likely will start going down soon during the Slow-Go years. We can then use our knowledge on the Retirement Spending Smile principle to front-load our spending a bit more during this period (e.g., 60-70) to take advantage of the remaining healthy years we have.
Front-Loading Joy: Retirement Smile Meets Die With Zero
It’s interesting to see how the Retirement Spending Smile aligns with the Die With Zero philosophy. If our goal is to maximize fulfillment and memorable experiences in life—not simply to maximize net worth at death—then using the Retirement Spending Smile concept to our advantage can make a lot of sense.
Remember: money’s utility often diminishes as your health and energy decline with age. Due to your health and available options, a dollar spent in your 50s and 60s is likely to bring you far more value in terms of memorable experiences and enjoyment than a dollar spent in your 80s. Armed with this knowledge, conventional retirees should be bolder about spending more early on while they still can.
This alignment between front-loaded spending and maximizing memorable experiences means retirees can better time their most meaningful purchases—whether it is travel, passion projects, giving, or spending quality time with loved ones—when they are still physically and mentally able to enjoy them most. Instead of smoothing spending equally over time, the Die With Zero mindset encourages us to consciously tilt our consumption to our earlier days of retirement, where both freedom and health intersect.
Does the Smile Curve Hold in Countries with Public Healthcare?
Healthcare in the US is notoriously expensive. Blanchett’s research relied on US government data; does this mean the Retirement Spending Smile may not actually apply in other countries?
While we can’t provide an answer for every single country, chances are that if you live in a country that has publicly-funded or guaranteed health care service (e.g., many European countries), then you likely don’t experience such a relevant uptick in expenses during your final No-Go years.
In many countries outside the US, healthcare costs still rise as you age, but most of them are covered by the public system. Having paid into it throughout your career (and often continuing to contribute in retirement), you’re far less exposed to large, unexpected medical bills late in life, beyond relatively minor copays.
Even if you retire early, many countries offer affordable ways to stay covered, either by paying into the state system or through private alternatives. The main exception is long-term care: nursing-home costs are often only partly covered, even within public systems, so they remain worth planning for.
What does this mean for retirees outside of the US? It means that the Retirement Spending Smile may turn into a Retirement Spending Sideways Smirk (see Figure below). They can probably be even more confident when revising downward their real retirement expenses over time. In this case, it likely makes even more sense to front load spending to the earlier, healthy years of retirement.

Live outside the US and not worried about healthcare costs in retirement? The Retirement Spending Smile might turn into a Retirement Spending Smirk! (high annual spending followed by a gradual decrease over time).
Granted, some may opt to relocate (or be relocated by loved ones) to higher-end nursing homes. I still think that, for most, this Retirement Spending Smile will likely not apply so strongly, given that these potentially higher expenses may balance out with no longer having the need to cover other living expenses you no longer have after the move, such as housing, taxes and utilities.
Final Takeaways: Plan Life, Not Just Withdrawals
The Retirement Spending Smile is more than a clever visual. It’s a realistic, data-backed reminder that retirement spending doesn’t remain constant over time. Most people tend to spend more when they are still active and healthy, and this naturally decreases over time as they age.
Ignoring the Retirement Spending Smile can lead to over-saving and over-working, delaying retirement and missing memorable life opportunities whilst still in good health.
For early retirees, the Smile isn’t a reason to target a smaller portfolio, but it is a useful reassurance. Knowing that spending tends to fall later in life can make it easier to enjoy your healthy early years without feeling guilty about it, in line with the Die With Zero mindset.
Whether you are retiring conventionally or aiming for early retirement, considering your actual spending curve—rather than assuming a flat line—can help you better optimize your savings goals and make smarter withdrawal decisions.
Remember, the real retirement risk might not be financial at all. The higher risk may be to mislive or look back with regret over too many healthy years wasted away for the sake of an overly conservative financial stability. Of course, you should save for the future, but remember to design your retirement timeline around the kind of life you want to remember.
💬 How are you preparing for retirement? Are you considering variable spending in your plans? How do you consider the Retirement Spending Smile if you aim to retire early? Please let us know in the comments below!
If you enjoyed this post, here are some next steps:
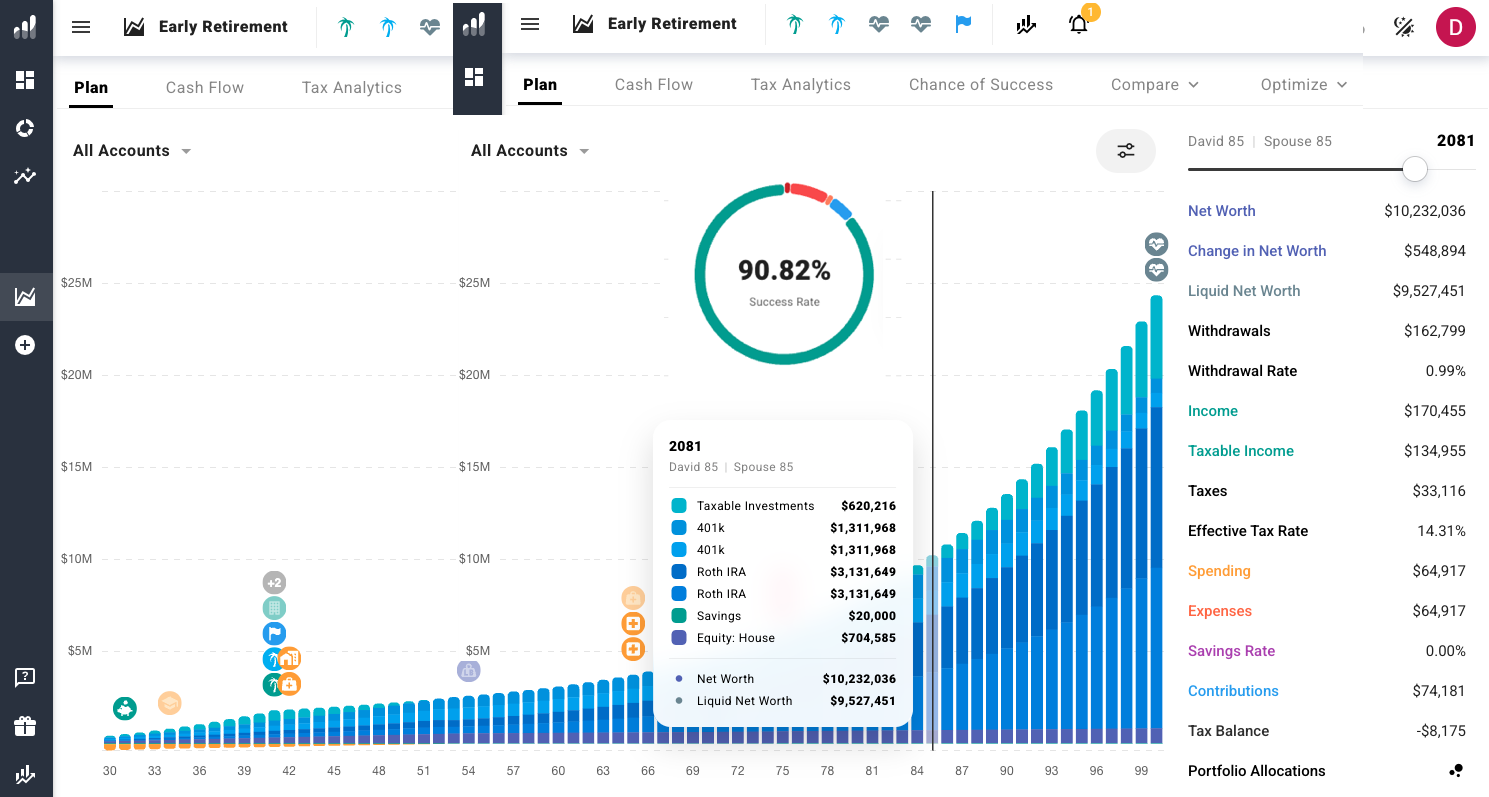
👉 Model changing spending phases in your own plan with ProjectionLab
👉 I think you’ll enjoy our articles on Bill Bengen’s updated 4.7% rule or our key takeaways from Bill Perkins’ influential Die With Zero bestseller book
👉 Test your early retirement timeline with our FI Calculator (free, email unlock) and see how different retirement spending affects your FI timeline
👉 Subscribe for free tools and our monthly newsletter
👉 Work with me: find out if you’re over-saving or not with a 1:1 FI Strategy Session
🌿 Thanks for reading The Good Life Journey. I share weekly insights on personal finance, financial independence (FIRE), and long-term investing — with work, health, and philosophy explored through the FI lens.
Disclaimer: I am not a financial adviser, and the content in this website is for informational and educational purposes only. Please consult a qualified financial adviser for personalized advice tailored to your situation.
Check out other recent articles




























About the author:
Written by David, a former academic scientist with a PhD and over a decade of experience in data analysis, modeling, and market-based financial systems, including work related to carbon markets. I apply a research-driven, evidence-based approach to personal finance and FIRE, focusing on long-term investing, retirement planning, and financial decision-making under uncertainty.
This site documents my own journey toward financial independence, with related topics like work, health, and philosophy explored through a financial independence lens, as they influence saving, investing, and retirement planning decisions.
Frequently Asked Questions (FAQs)
-
It’s a concept that describes how retiree spending typically decreases over time—starting high during the active years and tapering off as people age, before a potential small rise due to healthcare needs.
-
Because it assumes constant spending throughout retirement, it can lead to over-saving and working longer than necessary, especially when real-world spending tends to decrease with age.
-
Yes. Modeling your expenses more realistically, rather than assuming flat spending, can reduce the portfolio size you need—possibly allowing you to retire years earlier.
-
In the U.S., yes. But in many countries with public healthcare, costs are more predictable or covered, reducing the need for large end-of-life budgets.
-
No. The Retirement Spending Smile reflects average behavior observed in large datasets—not a rule that applies to everyone. It fits best for retirees with flexible, discretionary spending. Households with very tight budgets, chronic health issues, or minimal discretionary expenses may experience flatter or even rising spending patterns instead.
-
Generally, no—at least not early in retirement. For very early retirees with long time horizons, sequence-of-returns risk matters more than declining spending. The Retirement Spending Smile is most useful later, as you approach your 60s, when spending naturally begins to slow and you can reassess withdrawals more confidently.
Join readers from more than 100 countries, subscribe below!
Didn't Find What You Were After? Try Searching Here For Other Topics Or Articles: