The Crossover Point: How to Calculate Yours and Know When Work Becomes Optional

Praia da Bordeira, Algarve, Portugal. Portugal ranked 1st in our top 5 retirement destinations in Europe.
Reading time: 7 minutes
From Work Optional to Financially Free
This article explains exactly how to calculate your personal crossover point step by step—using very basic math, real-world examples, and a free tool that shows how close you are to Financial Independence (FI). You’ll also learn how the crossover point connects to early retirement and how to reach it faster by optimizing your expenses, income, and investments.
What you’ll get in this guide
✔ The crossover point formula explained
✔ A step-by-step method to calculate yours (expenses → safe withdrawal rate (SWR)* → target portfolio)
✔ A worked example + common mistakes to avoid
✔ A visual “wall chart” method to track progress
✔ A free tool to estimate your crossover point faster
*Safe Withdrawal Rate (SWR) is the percentage of your portfolio you can spend each year, adjusted for inflation, without a high risk of running out of money.
TL;DR — Crossover Point 🧮📈
🧠 Your crossover point is when investment income ≥ monthly expenses.
📌 Formula: Portfolio × SWR ÷ 12 (monthly income estimate).
🎯 Shortcut: FI number = annual expenses ÷ SWR (the portfolio you need).
🔧 Fastest levers: lower expenses, raise savings rate, keep investing consistently.
⚠️ Reality check: SWR isn’t guaranteed—build a buffer and stay flexible.
Quick Summary – Crossover Point Formula:
The crossover point is when investment income ≥ monthly expenses.
Monthly investment income ≈ Portfolio × SWR ÷ 12.
Example: $1,200,000 × 0.04 ÷ 12 = $4,000/month.
In other words, expenses of $4,000/month imply an FI number of ~$1.2M at a 4% SWR.
Short on time?
You can estimate your crossover point in under 60 seconds using our free FI Calculator. If you want, you can get access by subscribing (unsubscribe anytime). This article explains the logic behind the math.
How the Crossover Point Shows When Work Becomes Optional
Wondering how close you are to Financial Independence? This guide walks you through the crossover point. Whether you're new to FIRE (Financial Independence, Retire Early) or already saving aggressively, you'll learn how to calculate your crossover point, track progress visually, and use simple tools (like our FI Calculator—free for newsletter subscribers) to reach financial freedom faster.
When I first calculated my own crossover point many years ago, it was both humbling and motivating—it showed how far I was to replacing my salary with investment income, but also made me double down on tracking expenses monthly and saving as much as possible.
If you can calculate your crossover point, you can answer the most important FI question with real numbers: “How much longer until work is optional?” The rest of this post shows exactly how to calculate it, track it, and pull the levers that move it faster.
What Is the Crossover Point in Finance (and How to Calculate Yours)
The crossover point is reached when your investment income—usually based on your total assets and a safe withdrawal rate—exceeds your monthly living expenses. It's the moment your money starts working for you to the extent that work becomes optional, whether your target is LeanFIRE or FatFIRE. In FIRE terms, this is often described as the point where your portfolio’s passive income crosses your monthly expenses—a visual milestone that defines Financial Independence.
In other words, your passive income from investments is sufficient to sustain your lifestyle indefinitely. You can use our FI Calculator (free for newsletter subscribers) to estimate your crossover point and see how close you are to Financial Independence. A worked example is shown further below.
The tool also lets you model scenarios—showing how changes in spending, savings rate, returns, or retirement location can move the crossover point closer.
How to Calculate Your Crossover Point (Step-by-Step)
Step 1: Calculate your average monthly expenses
Use a 6–12 month average (ignore one-off spikes like holidays).
Step 2: Pick a conservative Safe Withdrawal Rate (SWR)
Many people start with 4% as per the 4% rule of thumb, but, ultimately, this depends on your risk tolerance and ability to be flexible in retirement. Very risk-averse investors prefer using 3-3.5% as SWR, while individuals that are willing to be flexible in their spending can sometimes use higher rates. If you’re new to this, it’s safer to treat anything above 4% as an aggressive assumption for now.
Step 3: Compute your “FI number” (target portfolio)
Formula: Annual expenses ÷ SWR.
Example: $48,000/year ÷ 0.04 = $1,200,000.
Step 4: Convert your current portfolio into monthly “investment income”
Formula: Portfolio × SWR ÷ 12.
Example: $800,000 × 0.04 ÷ 12 = $2,667 per month (rounded).
In this example, assuming someone already had a $800k portfolio, they wouldn’t have reached their crossover point yet because $2,667 doesn’t cover $4,000 in monthly expenses. When that monthly number meets or exceeds your expenses, you’ve reached the crossover point.
Step 5: Track your progress monthly
Update (a) expenses, (b) portfolio value, and (c) SWR-based income estimate to see how fast the gap is closing (this is presented visually further below; see Figures 2 and 3).
Your Next Step: Estimate Your Crossover Point
Everything above leads here. The FI Calculator applies the exact logic you just learned—it simply automates the math and lets you stress-test assumptions in seconds. If you want access, it’s free with the newsletter (unsubscribe anytime).
What the FI Calculator helps you do
Estimate your FI number (the portfolio needed to cover your expenses)
Translate your current portfolio into an estimated monthly “investment income” (based on your SWR)
Project how many years it may take to reach your crossover point under different savings rates
Compare how retiring in a lower-cost country could change your timeline
Inputs you’ll need (takes ~60 seconds)
Net annual income (after tax)
Current annual expenses (optionally, expected retirement expenses if they are different)
Current portfolio value (income-producing assets only—stocks, bonds, rentals; exclude your primary home)
Expected long-term real return (many people use 5–7% as a planning range)
Safe withdrawal rate (SWR), often 3.5–5% depending on your risk tolerance
The crossover point concept is widely attributed to Joe Dominguez and Vicki Robin, who popularized it in Your Money or Your Life. It remains a foundational FIRE idea because it gives you a simple, measurable answer to: When does work become optional? The methods below—tracking expenses, raising savings rate, and investing consistently—are the levers that move the crossover point closer
Common Crossover Point Calculation Mistakes
Using one unusually low-expense month (use a multi-month average instead or, better, consider your annual expenses)
Treating a 4% SWR as a guarantee rather than a planning assumption.
Ignoring taxes, healthcare, or big recurring costs in retirement spending.
Forgetting that early retirement usually needs a larger buffer than traditional retirement.
Case Study: Estimating Your Crossover Point With the FI Calculator
Now let’s run a realistic example using the FI Calculator to estimate the crossover point timeline—the moment investment income can cover monthly expenses. This is the information we’d enter in the tool to obtain our timeline:
Age: 32
Current portfolio: $250,000
Net annual income (after tax): $60,000
Annual expenses: $48,000/year ($4,000 x 12)
Annual expenses in retirement: let’s assume also $48,000/year
SWR: 4%
Annual real return on investments: 7% (we assume historic long-term returns from low-cost index funds). These are simplified assumptions to illustrate the concept—not a prediction.
As observed in the output of our FI calculator below, this individual would reach the crossover point in 17.4 years at age 49 under the assumptions laid out above. She would need to have accumulated a portfolio of $1.2M in today’s dollars and would reach Financial Independence nearly two decades before traditional retirement age. Of course, if she tightened her savings rate beyond the current 20%, she could reach Financial Independence point sooner.
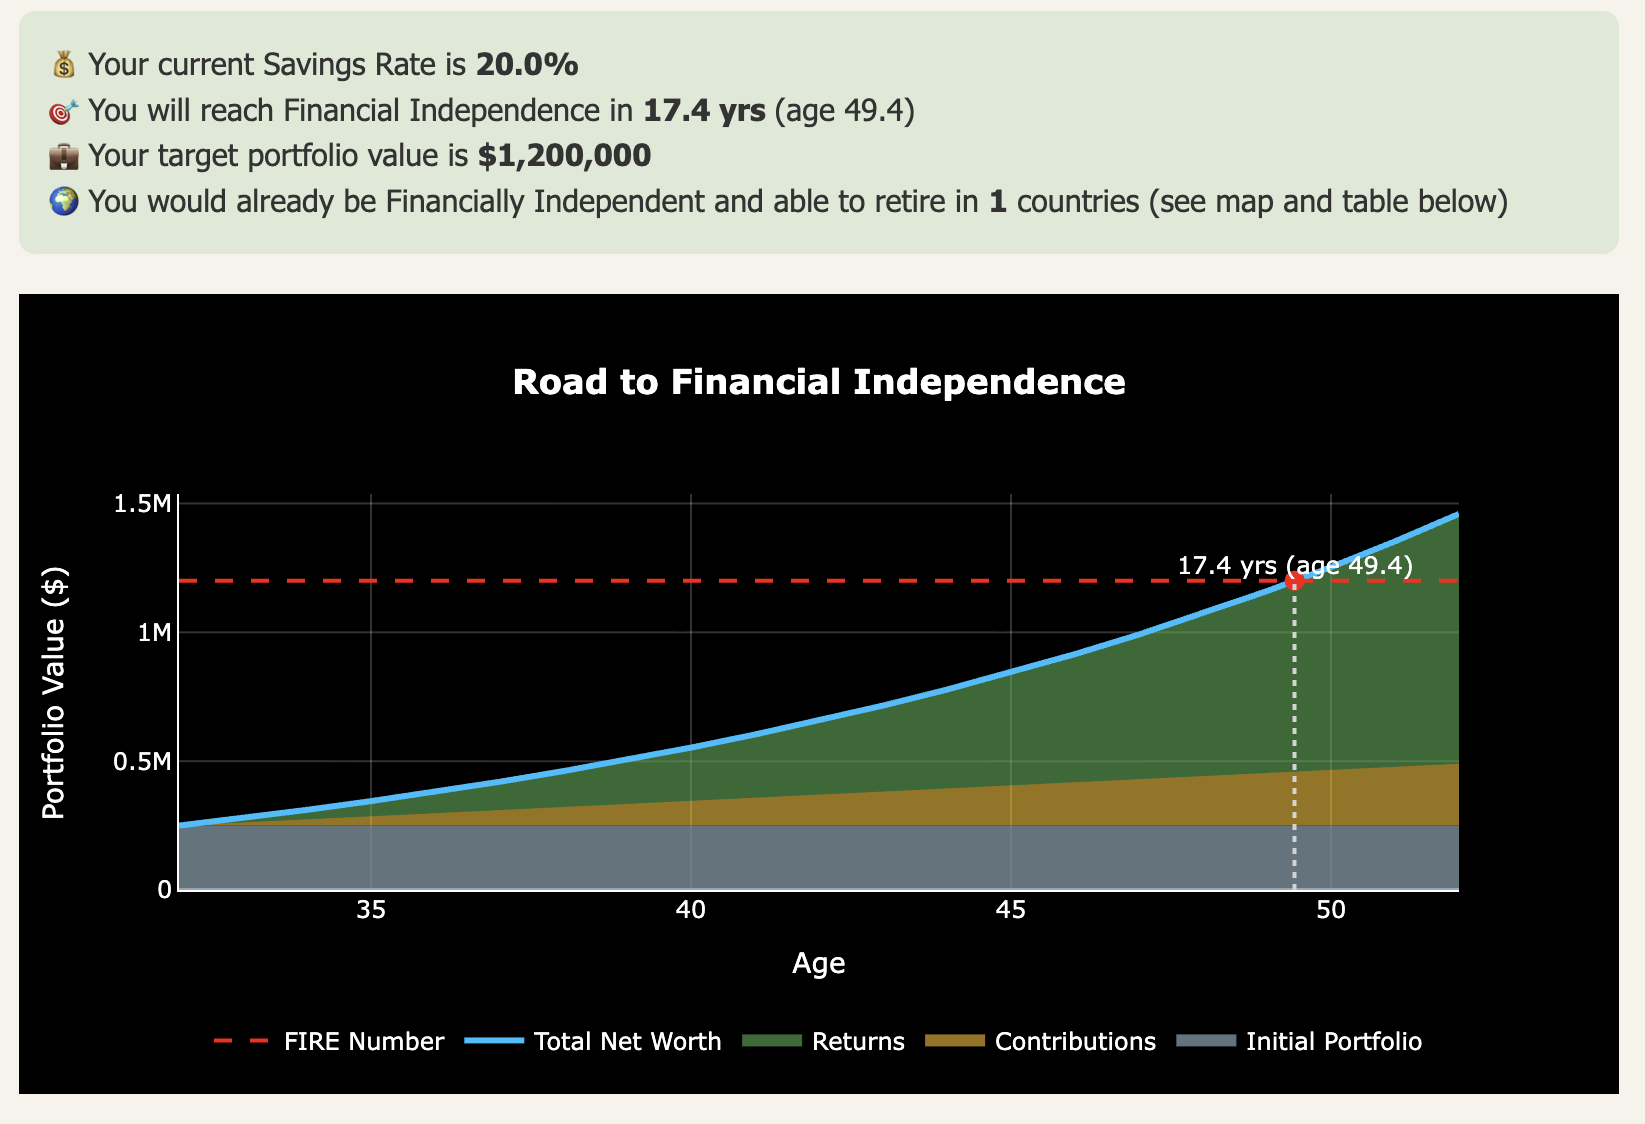
Figure 1: Screenshot of our FI Calculator (free for email subscribers). As observed, it takes a bit over 17 years to reach the crossover point of Financial Independence under the assumptions laid out above.
How to Track Your Financial Independence Progress (Chart & Example)
You can use a “wall chart” to track your progress towards Financial Independence. As part of her 9-step program to achieving Financial Independence, Vicky Robin advocates that you create your own “wall chart” to motivate you on your path to achieving financial freedom. In a nutshell, and as depicted in the Figure below, the wall chart is a graph that tracks in one place the evolution over time (x axis) of your income (blue), your expenses (green), and your (potential) passive income (purple).
This wall chart is a one stop representation of your financial journey over time, from full financial dependence (no income-generating assets) to full Financial Independence (income-generating assets cover your monthly expenses). Further below we explain how to track each of these lines.

Figure 2. Financial independence journey wall chart. Evolution of monthly income (blue), monthly expenses (green), and “potential” investment income based on assets.
How to Track and Cut Monthly Expenses to Reach FI
You can’t manage what you can’t measure. It is not much of an understatement to say that it will be nearly impossible for you to reach Financial Independence if you don’t have a good understanding of what you are spending your money on. A lot of high earners are terrible at tracking their expenses and have only a vague idea of what their savings rate is or where their money is going.
It’s really important to build the habit of tracking your expenses. Building this new muscle is the small price to pay for unlocking a lot more freedom in your life. In principle, you can choose any medium you’d like to record your expenses on. For most, a simple excel sheet is probably the best approach, since you will be able to store the information and compare the data easily across months.
The way I do it is as follows: at the end of each month, I spend no more than 30 minutes recording every single expense that has left my different accounts over the past month. I am particularly careful about recording cash payments separately; otherwise, it is easy to forget them several weeks later.
Understanding your average monthly expenses. You can start to have a solid understanding of your average monthly expense once you have recorded several months’ worth of data (see Figure 2, above). Of course, a real world example may look more messy than the wall chart provided here: you may have some months with unusually high expenses (for example, vacations or Christmas). It doesn’t matter—over time a pattern will emerge and your monthly expenses will become clear.
Cutting and optimizing expenses is crucial for Financial Independence. Every dollar saved accelerates your journey to the crossover point, since lowering expenses reduces the investment income you need to cover them. Once you have a clear picture of your spending habits, it's important to question your expenses and find areas where you can cut costs or make adjustments.
Ideally, if we want to speed our way to Financial Independence, we want the green line to go downwards. This doesn’t mean depriving yourself but rather making mindful choices. Are there subscriptions you don't use? Can you find cheaper alternatives for certain products or services? By bringing your expenses down or at least keeping them constant, you increase your savings rate and move closer to your crossover point.

Broken Beach, Sakti, Klungkung Regency, Bali, Indonesia. Indonesia recently made our top 3 best retirement destinations in Asia.
Track All Income Streams to Support Your FI Goals
It is equally important to track every dollar that enters your accounts. Make it a habit to record all your sources of income, whether it’s your salary, bonuses, side hustles, gifts, tax returns, or any other source. This also helps you calculate how each income source contributes to your crossover point. This detailed monthly tracking will allow you to see the full picture of your financial health and identify opportunities to increase your income.
Invest the Gap: How to Grow Your Net Worth Efficiently
The larger the difference between your income and expenses, the more you can save and invest, and the faster your net worth will grow. In this blog we advocate for simple, long-term investing in low-cost index funds or ETFs that track them. Generally, for most retail investors, it’s best to avoid stock-picking or going for moonshots—it almost never pays off.
The more consistently you invest the difference between income and expenses, the faster your crossover point approaches—a direct link between savings rate and years to Financial Independence.
Track Your Net Worth and Calculate Passive Income
Tracking your net worth is a crucial step in understanding your progress toward Financial Independence. Your net worth is the total value of all your assets minus your liabilities. By regularly calculating and updating your net worth, you can get a clear snapshot of where you stand financially and how close you are to reaching your crossover point.
To track your net worth, list all your assets, including cash, investments, real estate, and other valuable possessions. Then, subtract any debts, such as mortgages, loans, and credit card balances. This calculation will give you your current net worth. Monitoring this number over time will help you see the impact of your saving and investing efforts. It can also highlight areas where you might need to reduce debt or increase assets.
The purple line in Figure 2 represents 4% of your income-generating assets. The 4% rule (of thumb) is a spending rule that is used widely within the personal finance space to determine how much you can spend sustainably from your portfolio in retirement to avoid running out of money in your older years. As the name implies, it suggests that you can safely withdraw 4% of your savings portfolio in the first year upon retirement. This amount is adjusted for inflation in the years thereafter.
As we previously presented, the crossover point formula is:
Crossover Point = Total Investments x Safe Withdrawal Rate (SWR) ÷ 12
To illustrate, consider the last data point in June 2024 of the wall chart in Figure 2. It represents a portfolio of $350,000, made up of stocks and bonds. 4% of this amount could provide a monthly income of $1,167 ($350,000 * 0.04 / 12 months). Theoretically, this is the amount you could potentially withdraw in the long term from your portfolio without fear of running out of money.
Of course, the 4% rule is a general guideline based on US market data. In periods of low returns or high inflation, a slightly lower withdrawal rate (e.g., 3.5%) may be more prudent, or, better, to rely on variable spending strategies. Flexibility—adjusting withdrawals to market conditions—is key to long-term sustainability and could allow you to consider a higher SWR, which would allow you to retire sooner.
Either way, it’s important to understand that this model breaks down if you treat the SWR as a guarantee rather than a planning assumption—especially in long early retirements, high inflation regimes, and especially when spending is inflexible.
For now, we should consider this 4% figure as a ballpark number we are using to explain the crossover point. There is substantial nuance related to optimizing the Safe Withdrawal Rate to use even more favourable rates than the 4%.
What Happens When You Reach the Crossover Point (and What Comes Next)

Figure 3. The crossover point of Financial Independence (red square). You reach this point when 4% of your income-generating assets—normally, a portfolio of stocks and bonds—is sufficient to cover your monthly expenses (green). From this point on you no longer need to rely on paid employment.
The crossover point in personal finance occurs when 4% of your total investments can safely cover your average monthly expenses—as shown in the red box in Figure 3. This is the milestone that defines Financial Independence.
Many FIRE followers use this milestone as a psychological turning point: they may choose to work part-time, pursue passion projects, or even take mini-retirements knowing their investments cover core needs.
Reaching the crossover point of Financial Independence means that you no longer need to rely on traditional employment, as your investments generate sufficient income to cover your needs indefinitely—be it at a LeanFIRE level or a FatFIRE lifestyle.
While the crossover point marks a powerful milestone, it’s important to remember that the 4% rule is only a guideline—not a guarantee. As mentioned earlier, markets, inflation, and lifestyle needs change over time. That’s why many experienced retirees prefer variable withdrawal strategies like the Variable Percentage Withdrawal (VPW) or guardrail approaches, which adjust spending up or down depending on market performance.
These dynamic strategies can help protect your portfolio during downturns while allowing you to spend more freely when returns are strong—making Financial Independence more resilient in practice.
If this article clarified how the crossover point works, here’s the natural way forward:
👉 Estimate your crossover point using our free FI Calculator (email unlock).
👉 New to Financial Independence? Start with our Start Here guide for the full framework.
👉 Subscribe to get free FI tools and the weekly newsletter (one-click unsubscribe anytime).
🌿 Thanks for reading The Good Life Journey. I share weekly insights on personal finance, financial independence (FIRE), and long-term investing — with work, health, and philosophy explored through the FI lens.
Disclaimer: I’m not a financial adviser, and this is not financial advice. The posts on this website are for informational purposes only; please consult a qualified adviser for personalized advice.
About the author:
Written by David, a former academic scientist with a PhD and over a decade of experience in data analysis, modeling, and market-based financial systems, including work related to carbon markets. I apply a research-driven, evidence-based approach to personal finance and FIRE, focusing on long-term investing, retirement planning, and financial decision-making under uncertainty.
This site documents my own journey toward financial independence, with related topics like work, health, and philosophy explored through a financial independence lens, as they influence saving, investing, and retirement planning decisions.

Tulum, Mexico. Mexico made our top 5 best retirement locations in Latin America.
Check out other recent articles


Remember, financial success does not have to be a solitary journey. There is a thriving community of like-minded individuals who share resources, tips, and motivation to help you on your financial path. From groups on Reddit to different blogs and podcasts, the Financial Independence community is full of valuable insights. To stay up to date with the latest ideas and discussions, I recommend using FIRE Aggregator. It’s an excellent resource that consolidates the best content in the FI space into one place, saving you time while keeping you informed and inspired.
Frequently Asked Questions (FAQs)
-
The crossover point is the moment when your monthly passive income—typically from investments—exceeds your monthly living expenses, meaning you no longer rely on a paycheck. At this point, you could quit your job if you chose to.
-
To calculate your crossover point, divide your average monthly expenses by 4%, or use our Financial Independence Calculator to estimate when your investments will cover your lifestyle.
-
The basic formula is:
Target portfolio = Monthly expenses × 12 ÷ 0.04
This gives you the total amount of income-generating assets needed to sustain your expenses with a 4% withdrawal rate. -
Reaching the crossover point means your investments can support your lifestyle indefinitely, giving you the option to stop working and reclaim your time.
-
Yes, the crossover point simply gives you the freedom to choose. Whether you continue working or not, your income is no longer tied to employment.
-
Use a combination of a monthly budget tracker, net worth tracker, and our FIRE calculator to visualize your journey.
-
The 4% rule is a general guideline. While it's widely used in the FIRE community, adjusting for inflation, lifestyle, or lower market returns may improve accuracy. There is substantial nuance to using different Safe Withdrawal Rates—higher rates than 4% are possible given certain conditions.
-
The crossover point marks the point where your investments generate enough passive income to cover your expenses. In FIRE planning, this milestone shows when early retirement becomes financially sustainable—often years or decades before the traditional retirement age.
-
You can reach the crossover point faster by increasing your savings rate, reducing expenses, and investing consistently in low-cost index funds. Tracking both income and spending helps identify where to improve your savings gap—the biggest lever in accelerating Financial Independence.
-
Include all recurring, long-term living expenses needed to sustain your lifestyle: housing, food, insurance, healthcare, taxes, and regular discretionary spending.
Use expected retirement-level expenses, smoothing irregular costs (travel, car replacement, medical) into annual averages for a realistic estimate. -
Multiply your total invested assets by a safe withdrawal rate (e.g., 4%) and divide by 12 to get a monthly income estimate. When this number exceeds your average monthly expenses, you’ve reached your crossover point. Tools like our FI Calculator make this easy to visualize.
Join readers from more than 100 countries, subscribe below!
Didn't Find What You Were After? Try Searching Here For Other Topics Or Articles: